今年,美国原油出口翻倍,中国再度成全球原油最大买家。
作者 | 甲基橙
一、 全球原油出口国TOP15
当前,除汽车之外,原油是全球贸易中出口量最大的商品,单是2016年,原油出口额就高达6781亿美元,占全球商品出口总额的4.3%。然而,受国际油价震荡影响,这一数字较2012年下降了59.4%之多,较2015年下降了11.4%。那么,原油出口最多的国家和地区又有哪些变化?
2016年,整个中东国家的原油出口额仍为最高,达3106亿美元,占全球原油出口总额的45.8%,相比之下,欧洲占17.7%,非洲占12.6%,北美占9.3%,亚洲占6.8%。拉丁美洲(不包括墨西哥)和加勒比海的原油出口额占6.7%。
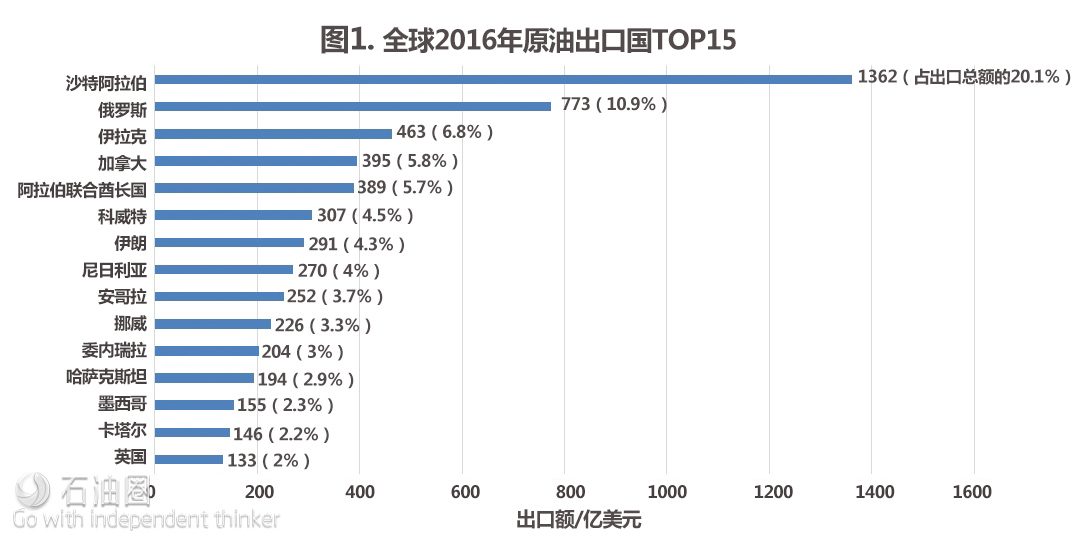
图1为2016年全球排名靠前的十五大原油出口国及其出口额占全球原油出口总额的比例。

分析可知,与2012年的出口额相比,2016年,上述所有产油国的原油出口均出现了大幅下降,伊拉克下降32.5%,尼日利亚下降72.8%,委内瑞拉下降70.4%,墨西哥下降66.9%,哈萨克斯坦下降65.7%,安哥拉下降63.5%。由于大部分产油国对石油收入存在严重的依赖,两年多的低油价造成了这些国家出现了严重的财政赤字。近日,以沙特为首的海湾国家“群殴”卡塔尔,使中东局势再次动荡,其影响可能危及整个中东地区的石油供给。
二、 全球原油净出口国TOP15
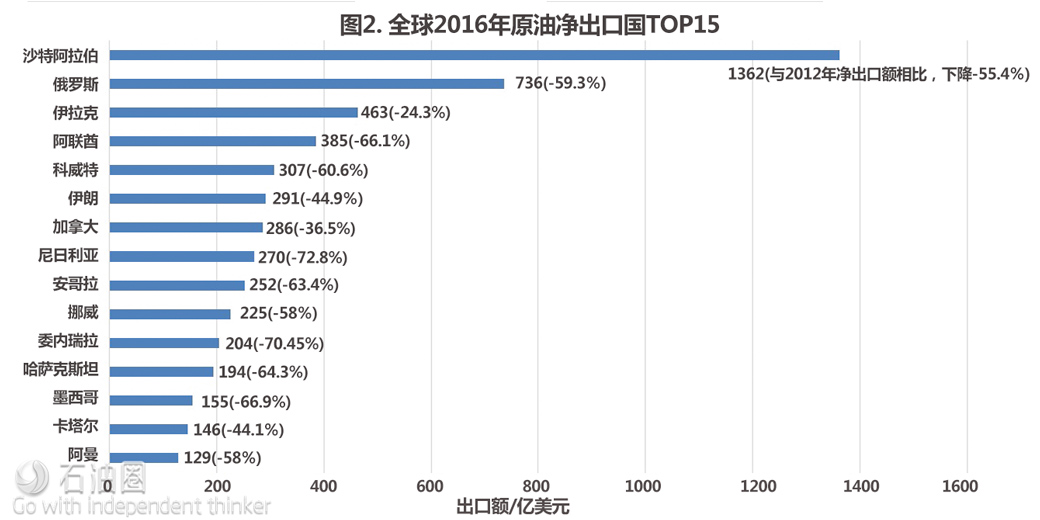
然而,出口原油多的国家并非是原油净出口国家,原油净出口额为原油总出口额与总进口额之间的差值,也就是说,产油国的原油出口额与进口额之间存在一定盈余。一些产油大国受其国内经济成长影响,对原油需求蹿升,因此他们并非为净原油进口国。图2是2016年全球原油净出口最多的国家及其净出口额与2012年的对比。

沙特阿拉伯是原油净出口最多的国家,这也是沙特王室为什么会成为世界上最富有家族的原因。俄罗斯和伊拉克也保持其净出口国的排名。从另一个角度看,这些国家充足的原油产量确保了他们在市场上明显的竞争优势。
石油目前仍处于买方市场。那么,受油价波动影响,全球原油进口最多的国家有哪些变化呢?
三、 全球原油进口国TOP10
图3为2016年全球原油净进口最多的国家及其进口额与2012年的对比。

很明显,中国是全球第一大原油进口国。与2012年原油出口额相比,各国原油进口均有大幅下降,这主要受2012年以来全球原油赤字影响,而中国原油国际贸易逆差最为缓慢。与2012年相比,中国的原油赤字下滑了47.3%之多。
如今,OPEC减产协议执行情况充满不确定性、美国石油生产不断创历史新高,全球原油市场供需不平衡的局面很可能仍将持续更长时间,而原油买方市场特征依旧明显,在这里,中国和美国将起到关键作用。
四、 美国的原油进口状况将会改变
虽然近来美国油气产量一直在创历史新高,但美国仍是体量很大的原油进口国,在过去30年,美国从全球各地进口的原油超过91亿桶,图4是其原油进口最多的国家排名,这些国家的进口额占美国原油进口总额的86%。

美国国内油气产量持续大幅增长正在改变美国的能源格局,给美国带来广泛的经济、安全和地缘政治影响力。根据EIA的资料,由于页岩油气产量持续从全球油气行业低迷中复苏,2018年美国石油产量将达到47年来的最高,其净进口量和消费量均在逐步减少。同时,美国今年的原油出口将翻倍,逐渐从净进口国向出口国转变。
五、 中国原油进口格局多元化
根据近期的EIA周报可知,因担心对亚洲的原油供应趋紧、产油国减产计划延至明年3月以及国内炼厂增加海外销售需求,中国5月份原油进口大幅增加,并再次成为全球最大的原油进口国。根据中国海关总署公布的数据显示,中国5月进口原油876万桶/天,高于美国同期812万桶/天的原油日均进口量,同时,较去年同期提高15%,比4月亦高出近8%。
中国再次成为全球原油最大买家,这说明中国的对外石油依存度仍在不断上涨。此前就有报道称,中国对外石油依存度已经超过65%,未来将会更大,而中国也在不断开拓渠道,从多个国家进口原油。
过去,中国一半的原油进口来自于沙特、安哥拉和伊朗等OPEC国家,近年来,中国进口了更多美国和巴西的原油。同时,受OPEC减产影响,中国对非洲原油依赖度也达到了前所未有的程度。
受中国国内原油的减产影响和独立地炼企业需求旺盛支撑,2016年俄罗斯首次取代沙特阿拉伯,成为中国最大原油供应国。

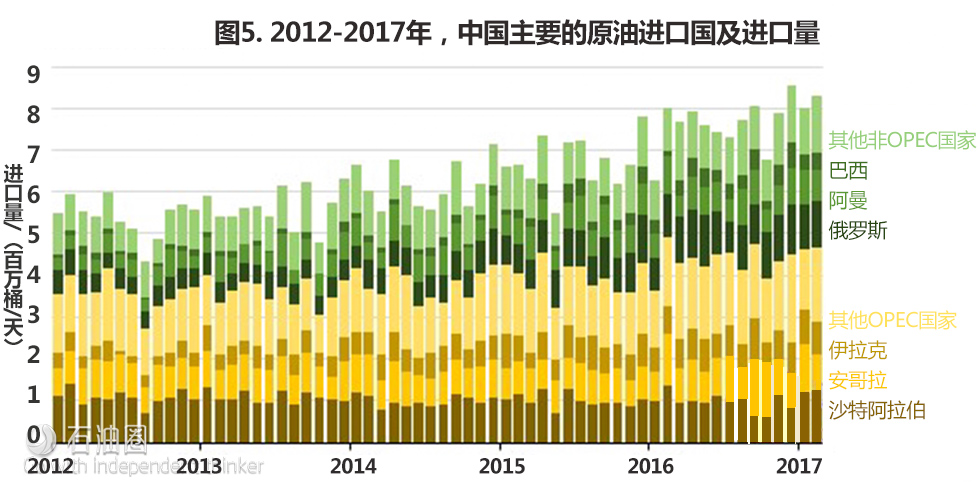
由图5可知,2016年俄罗斯对中国的原油出口增长近1/4,达105万桶/日,沙特位列第二,对中国原油出口量为102万桶/日,较上年同期增长0.9%。第三大进口国是安哥拉,该国2016年供应量较2015年增长13%,排名第四的是伊拉克。去年中国还增加了从南美国家的原油进口,从巴西的进口量增长37.6%,从委内瑞拉进口量增长26%。
中国的原油进口量在2012-2016年年间增加220万桶/天,非OPEC国家所贡献的原油市场份额增长明显,从34%增至43%,主要是俄罗斯、阿曼与巴西,而巴西和英国变化不大。
Oil is the world’s number 2 export product outpaced only by exported cars. Amounting to 4.3% of the global value of all export products, crude oil shipments totaled US$678.1 billion for 2016.
That figure represents a -59.4% drop in value since 2012 and a -11.4% decline from 2015 to 2016.
Middle Eastern countries accounted for the highest dollar value worth of crude oil exports during 2016 with shipments valued at $310.6 billion or 45.8% of global crude oil exports. This compares with 17.7% for Europe, 12.6% for Africa, 9.3% for North America, 6.8% for Asia and 6.7% for Latin America (excluding Mexico) and Caribbean exporters.
The 4-digit Harmonized Tariff System code prefix for crude oil is 2709.
Crude Oil Exports by Country
Below are the 15 countries that exported the highest dollar value worth of crude oil during 2016:
Saudi Arabia: US$136.2 billion (20.1% of total crude oil exports)
Russia: $73.7 billion (10.9%)
Iraq: $46.3 billion (6.8%)
Canada: $39.5 billion (5.8%)
United Arab Emirates: $38.9 billion (5.7%)
Kuwait: $30.7 billion (4.5%)
Iran: $29.1 billion (4.3%)
Nigeria: $27 billion (4%)
Angola: $25.2 billion (3.7%)
Norway: $22.6 billion (3.3%)
Venezuela: $20.4 billion (3%)
Kazakhstan: $19.4 billion (2.9%)
Mexico: $15.5 billion (2.3%)
Qatar: $14.6 billion (2.2%)
United Kingdom: $13.3 billion (2%)
All of the above international traders posted declines in the value of their crude oil exports from 2012 to 2016, ranging from -32.5% for Iraq to -72.8% for Nigeria. Other fast-declining crude oil exporters were: Venezuela (down -70.4%), Mexico (down -66.9%), Kazakhstan (down -65.7%) and Angola (down -63.4%).
The listed 15 countries accounted for 81.4% of all crude oil exports in 2016 (by value).
The following countries posted the highest positive net exports for crude oil during 2016. Investopedia defines net exports as the value of a country’s total exports minus the value of its total imports. Thus, the statistics below present the surplus between the value of each country’s crude oil exports and its import purchases for that same commodity.
Saudi Arabia: US$136.2 billion (net export surplus down -55.4% since 2012)
Russia: $73.6 billion (down -59.3%)
Iraq: $46.3 billion (down -24.3%)
United Arab Emirates: $38.5 billion (down -60.1%)
Kuwait: $30.7 billion (down -60.9%)
Iran: $29.1 billion (down -44.9%)
Canada: $28.6 billion (down -36.5%)
Nigeria: $27 billion (down -72.8%)
Angola: $25.2 billion (down -63.4%)
Norway: $22.5 billion (down -58%)
Venezuela: $20.4 billion (down -70.4%)
Kazakhstan: $19.4 billion (down -64.3%)
Mexico: $15.5 billion (down -66.9%)
Qatar: $14.6 billion (down -44.1%)
Oman: $12.9 billion (down -58%)
Saudi Arabia has the highest surplus in the international trade of crude oil. In turn, this positive cashflow confirms Saudi’s strong competitive advantage for this specific product category.
The following countries posted the highest negative net exports for crude oil during 2016. Investopedia defines net exports as the value of a country’s total exports minus the value of its total imports. Thus, the statistics below present the deficit between the value of each country’s crude oil import purchases and its exports for that same commodity.
China: -US$115.2 billion (net export deficit down -47.3% since 2012)
United States: -$99.8 billion (down -68.7%)
India: -$60.9 billion (down -59.1%)
Japan: -$50.8 billion (down -66.8%)
South Korea: -$44.2 billion (down -59.2%)
Germany: -$28.7 billion (down -62.5%)
Netherlands: -$22.3 billion (down -61%)
Italy: -$18.7 billion (down -66.8%)
Spain: -$18.4 billion (down -60.2%)
France: -$17.9 billion (down -62.1%)
Singapore: -$15.1 billion (down -62.3%)
Thailand: -$14.7 billion (down -56.9%)
Taiwan: -$12.9 billion (down -63.9%)
Belgium: -$10.7 billion (down -60.5%)
Poland: -$7.1 billion (down -63.7%)
China incurred the highest deficit in the international trade of crude oil albeit at a slowing pace given the -47.3% drop in its crude oil deficit size since 2012. Still, the negative cashflow highlights China’s strong competitive disadvantage for this specific product category. The other side of the coin is that these deficits signal opportunities for crude oil-supplying countries that help satisfy the powerful demand, but also for entrepreneurs who develop alternative energy sources that can power industrial economies.
Crude Oil Exporting Companies
Based on the Forbes 2016 Global 2000 rankings, the following oil and gas companies are among the top 100 largest companies in the world:
Exxon Mobil (United States)
PetroChina (China)
Royal Dutch Shell (Netherlands)
BP (United Kingdom)
Chevron (United States)
Gazprom (Russia)
Total (France)
Sinopec-China Petroleum (China)
Petrobras (Brazil)
Rosneft (Russia)
Eni (Italy)
Statoil (Norway)
ConocoPhillips (United States)
LukOil (Russia)
The above corporations are presented in the same order as they appear in Forbes listings. Shown within parentheses is the country where each conglomerate has its headquarters.
未经允许,不得转载本站任何文章:
-

- 甲基橙
-
石油圈认证作者
- 毕业于中国石油大学(华东),化学工程与技术专业,长期聚焦国内外油气行业最新最有价值的行业动态,具有数十万字行业观察编译经验,如需获取油气行业分析相关资料,请联系甲基橙(QQ:1085652456;微信18202257875)


 石油圈
石油圈


